How to import a Bill of Quantities (BOQ)
Written By Gabriel Makinwa
Last updated 7 days ago
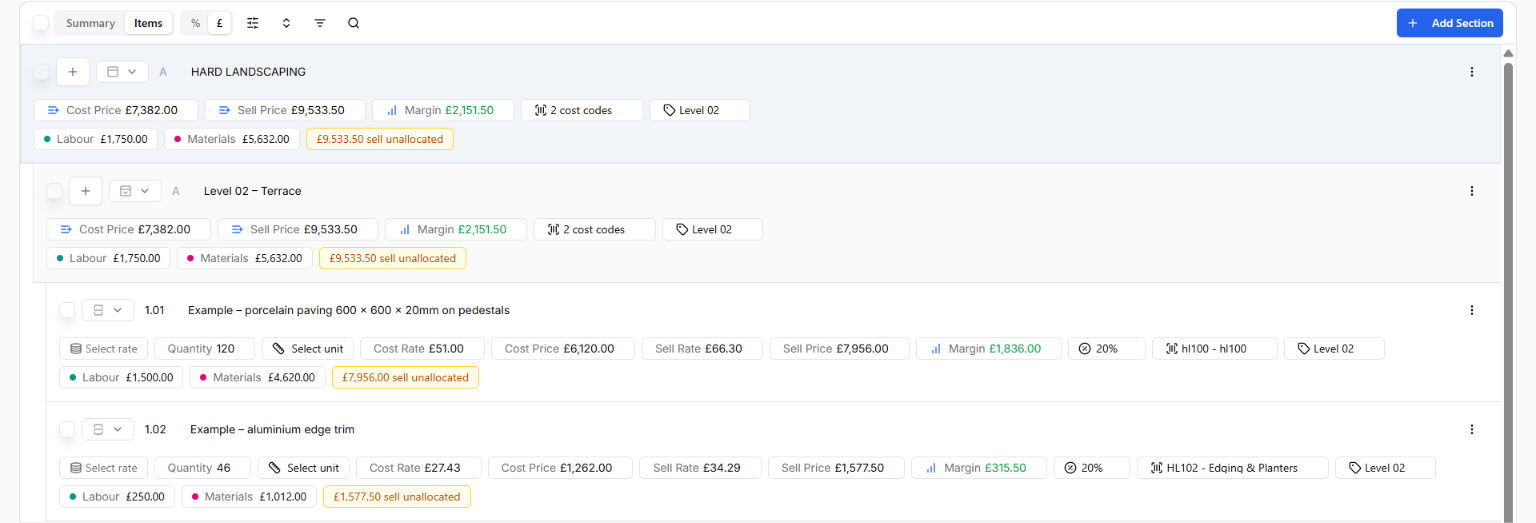
Coreloops lets you import your existing Bill of Quantities from an Excel spreadsheet, so you can set up your project without entering line items by hand. You choose how much detail comes in: just the structure and rates, cost codes and tags as well, or a full breakdown of every line into labour, subcontract, plant and materials.
Choose your level of detail
Each level builds on the one before. Follow Level 1 for every import, then add the steps for Level 2 or 3 if your spreadsheet has that detail.
Before you start: Prepare your spreadsheet
These apply regardless of the level you choose.
File format: an Excel file (.xlsx). CSV and Google Sheets aren't supported. In Google Sheets, use File → Download → Microsoft Excel (.xlsx).
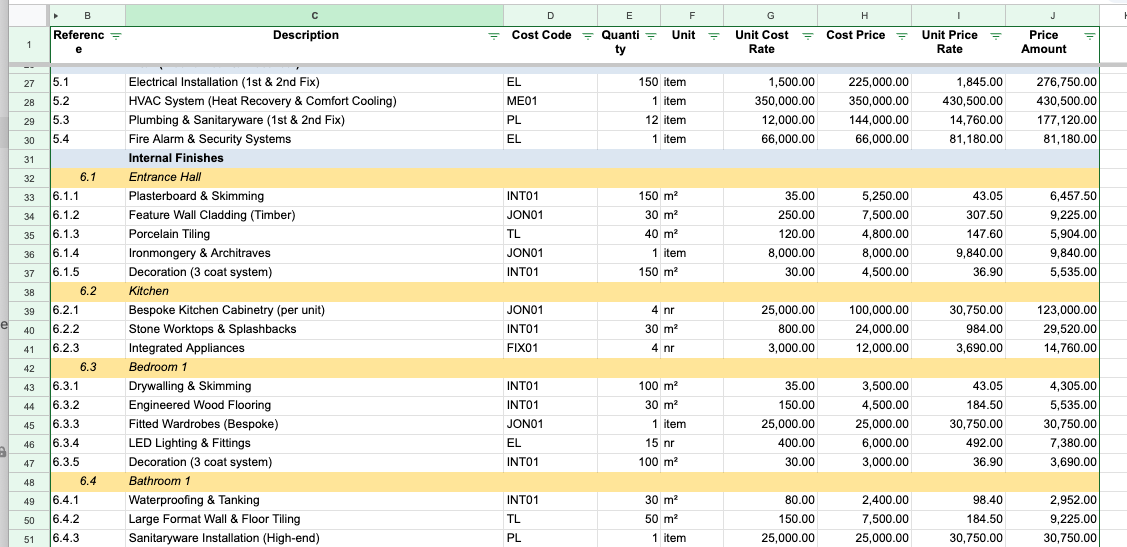
Start at the header row: remove summary rows, total rows and project header rows above your column titles (Description, Quantity, Unit, Rate).
One sheet: if net and gross costs are in separate files or tabs, put them side by side on one sheet.
One Description column for both headings and line items. Every row needs a description.
Colour-code your structure (recommended): highlight sections in one colour (e.g. blue) and sub-sections in another (e.g. yellow). Leave line items unformatted. Coreloops detects the colours and picks up your structure for you.
Level 1: Import sections, sub-sections and line items
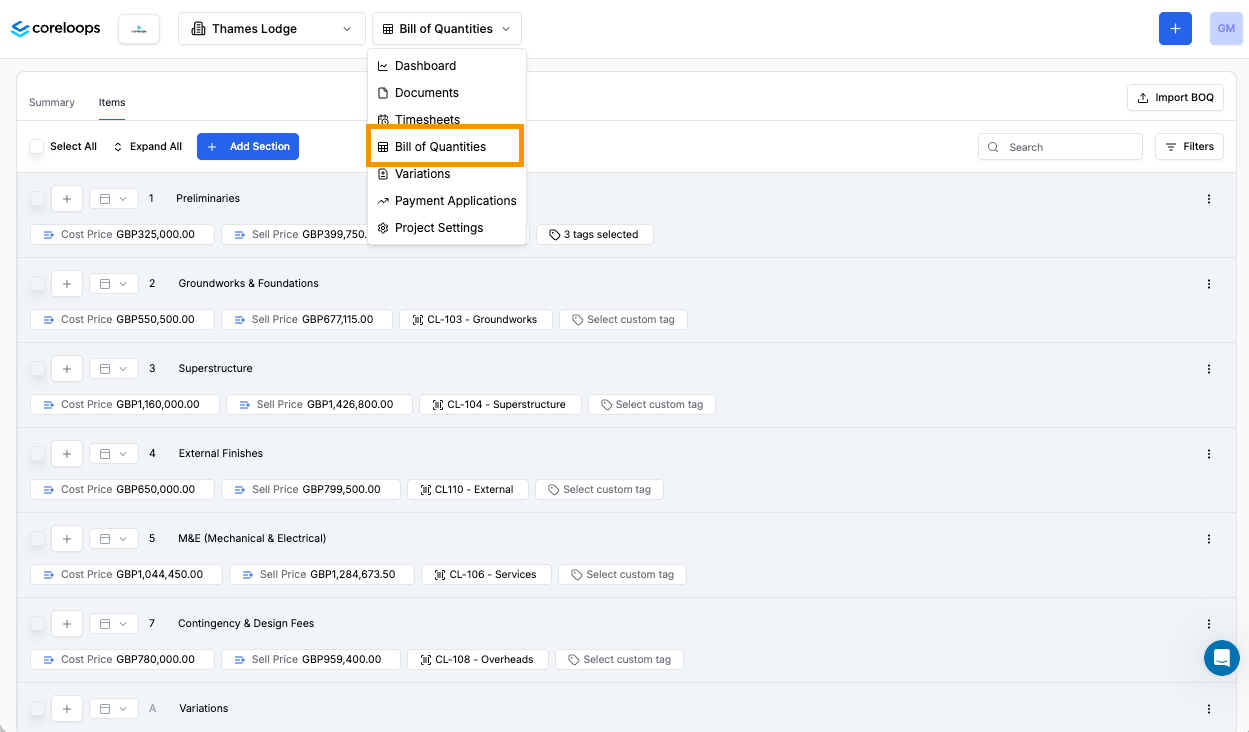
Step 1 — Open the Bill of Quantities
Open your project and go to the Bill of Quantities module.
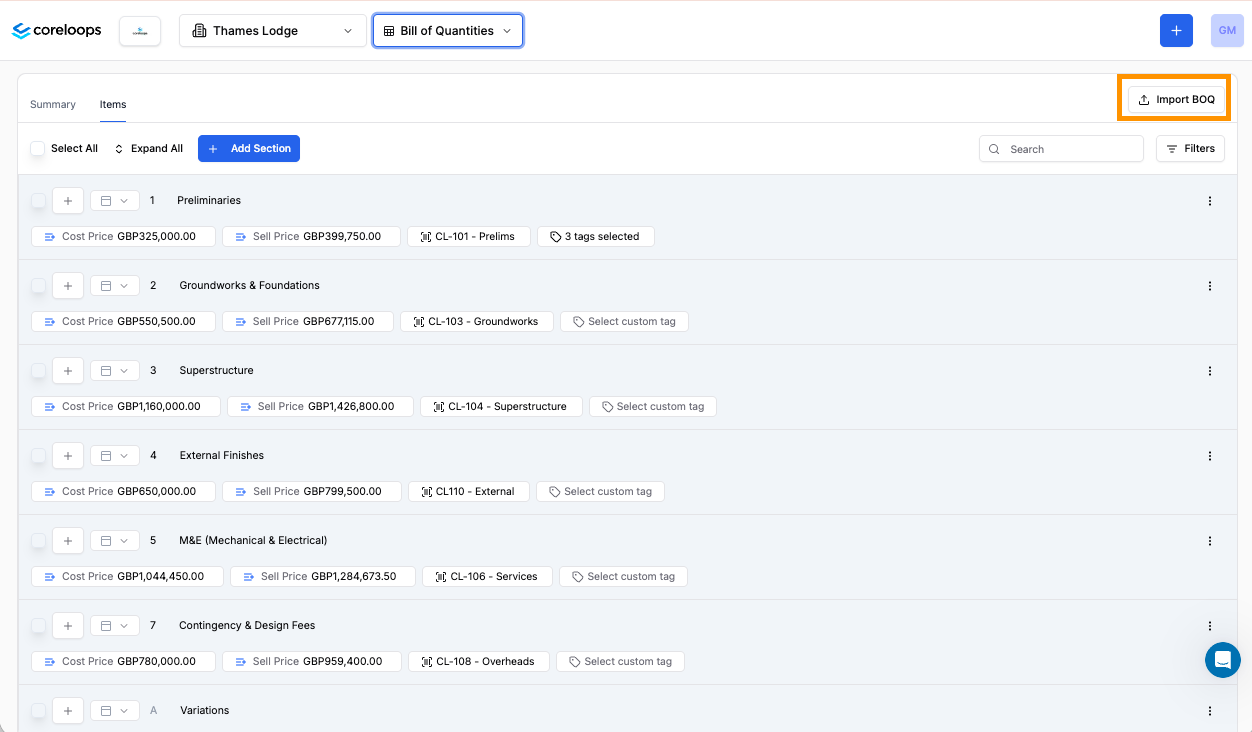
Step 2 — Click Import BOQ
On an empty BOQ, click Import BOQ in the top-right corner.
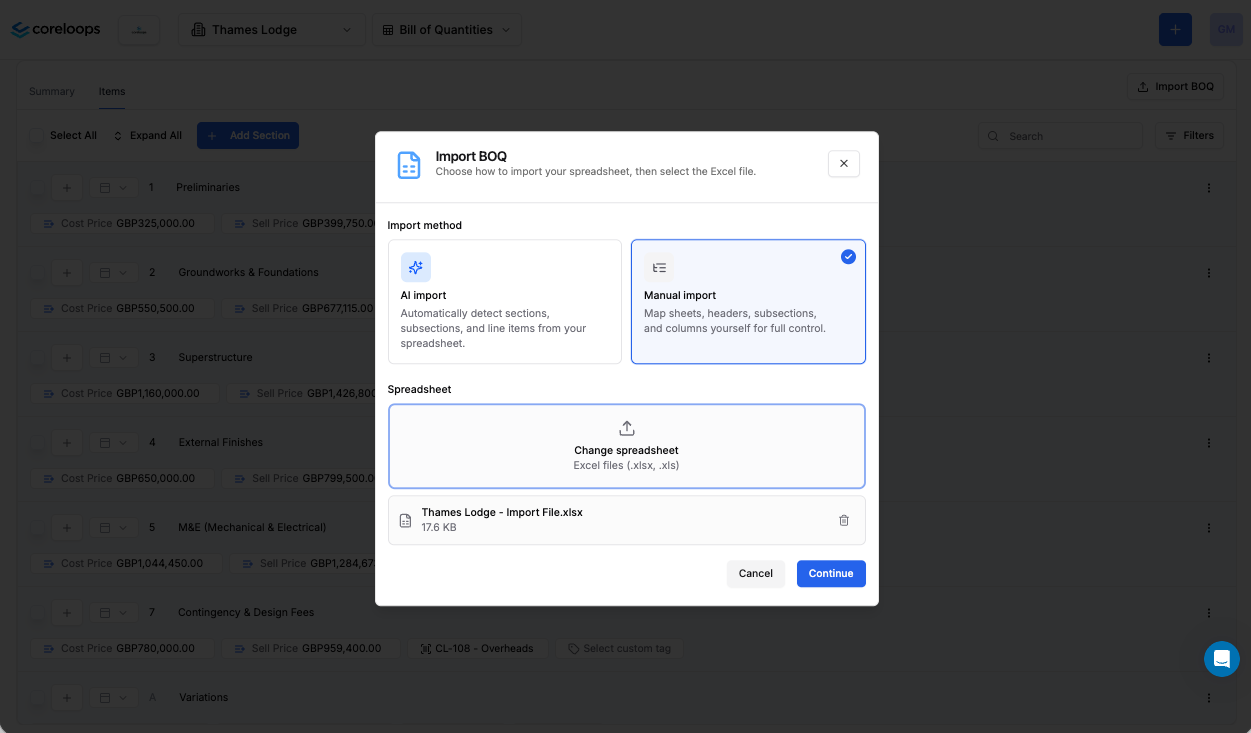
Step 3 — Choose Manual Import
Select Manual Import from the options shown and click the upload box to browse for your .xlsx file. Click Continue once your file is selected. Drag and drop isn't supported yet, so use the file picker.
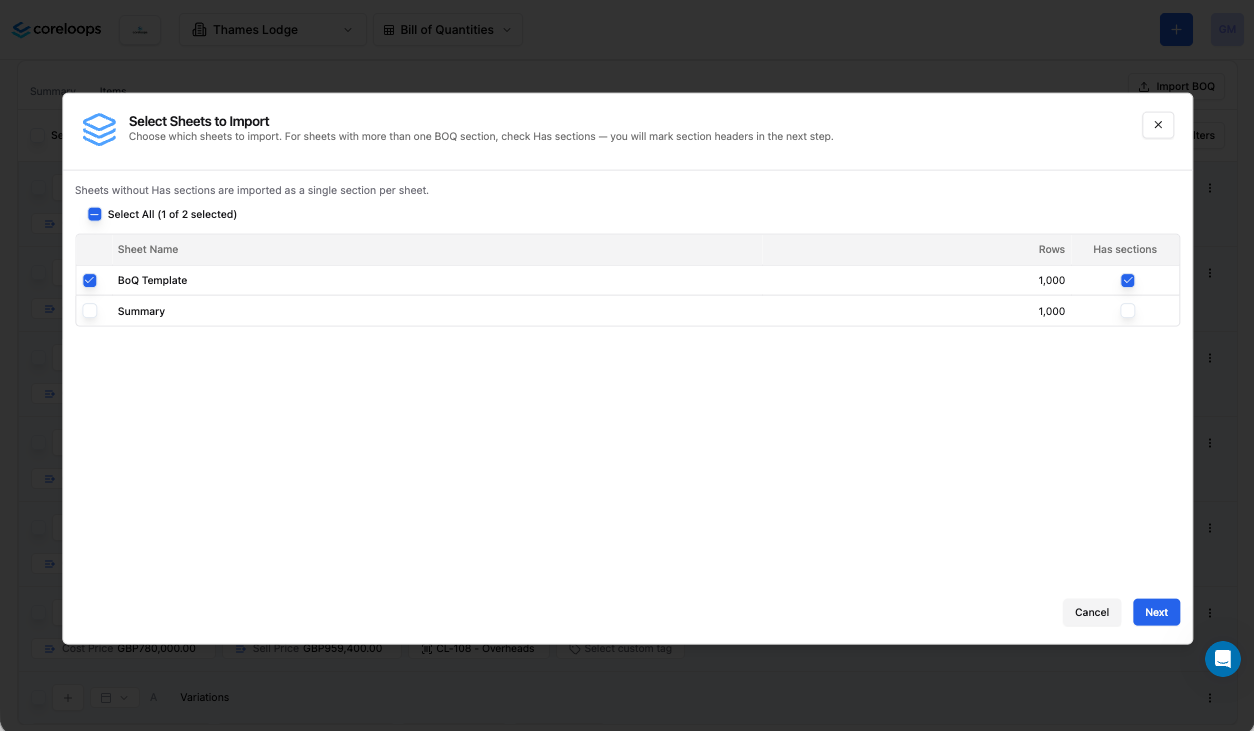
Step 4 — Select your tabs
The system shows all the tabs in your spreadsheet. Select the tabs you want to include in this import.
If a tab contains multiple sections within it (rather than one section per tab), tick Has sections for that tab.
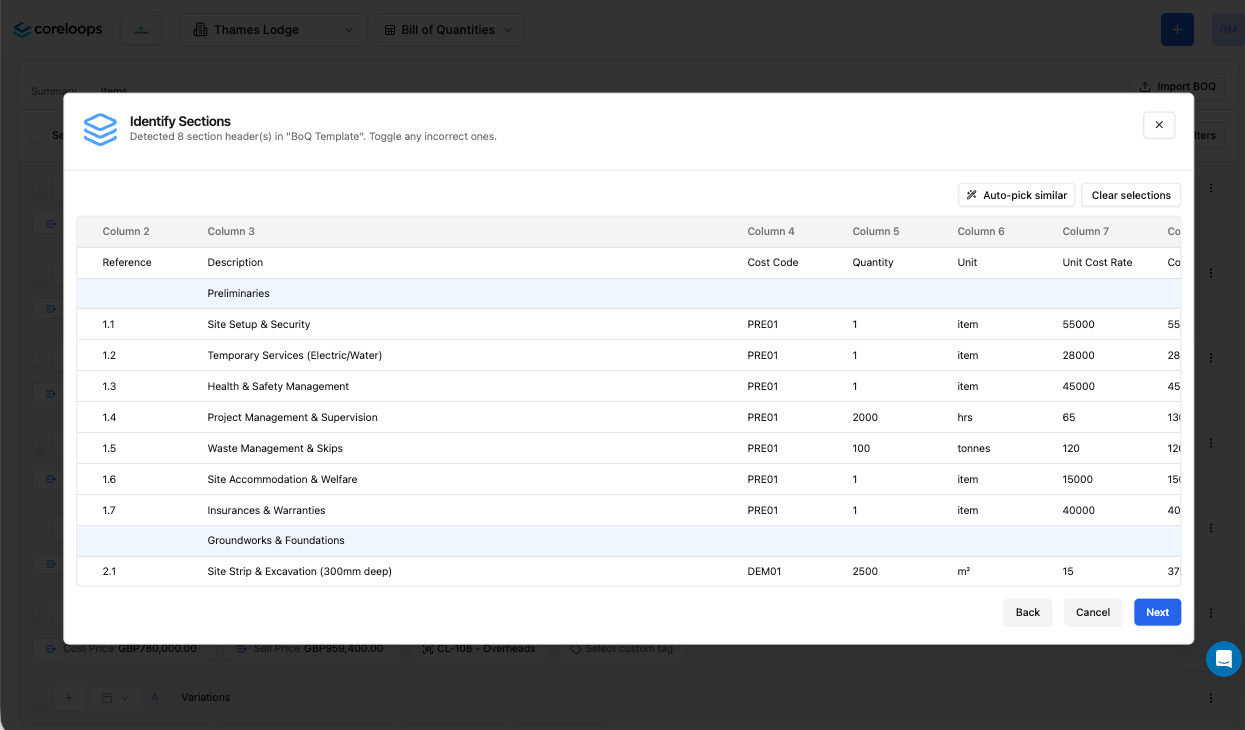
Step 5 — Identify your sections
Click on a row that represents a section header. If you've colour-coded your sections, the system automatically detects all rows with the same colour and confirms the count — for example: "9 section headers detected".
Scroll through to check the highlighted rows look correct, then click Next.
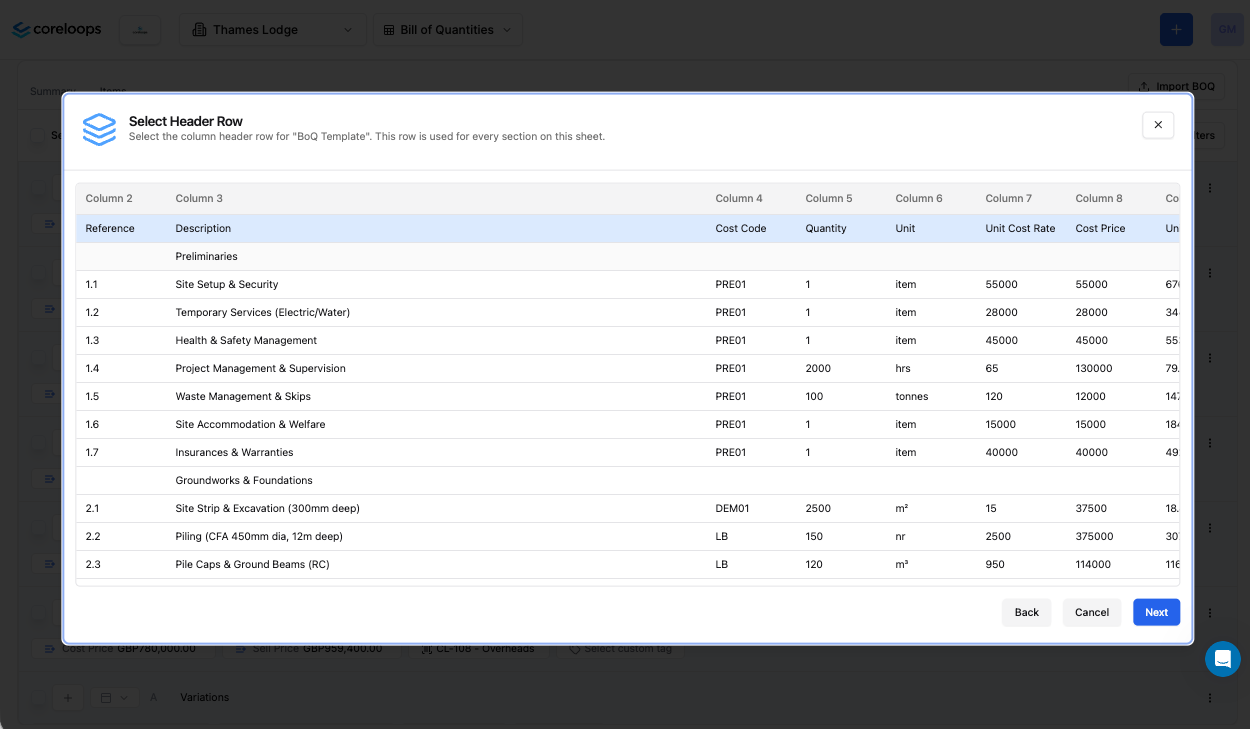
Step 6 — Select your header row
Click the row that contains your column titles (Description, Quantity, Unit, Rate, etc.). This should be the first row in your cleaned-up sheet. Click Next.
Step 7 — Identify your subsections
For each section, select the rows that are subsection headings. Once you've done two sections, you'll be asked whether to apply the same pattern to all remaining sections — click Apply to all to save time.
Click Next.
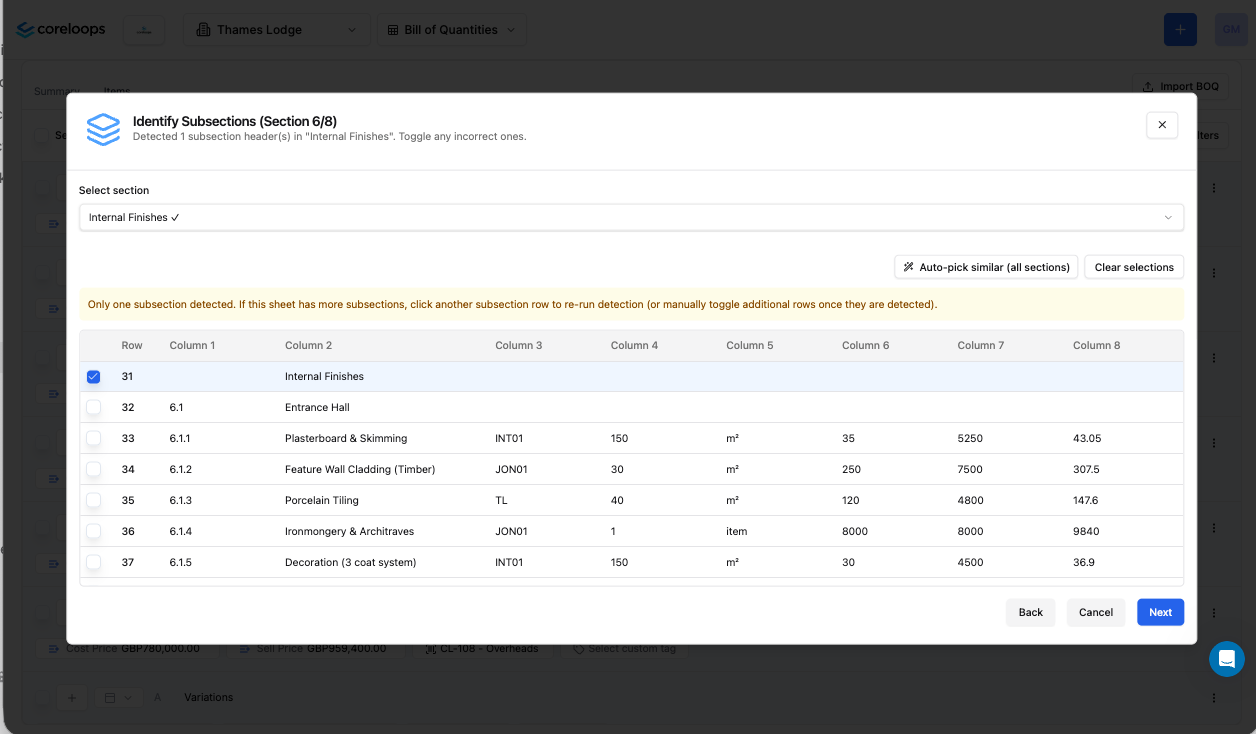
Step 8 — Map your columns
Click Auto-map columns, then check each match and correct any that are wrong.
If your sheet has more than one section, use Select section to move between them and click Save & Configure Next Section for each, then click Next.
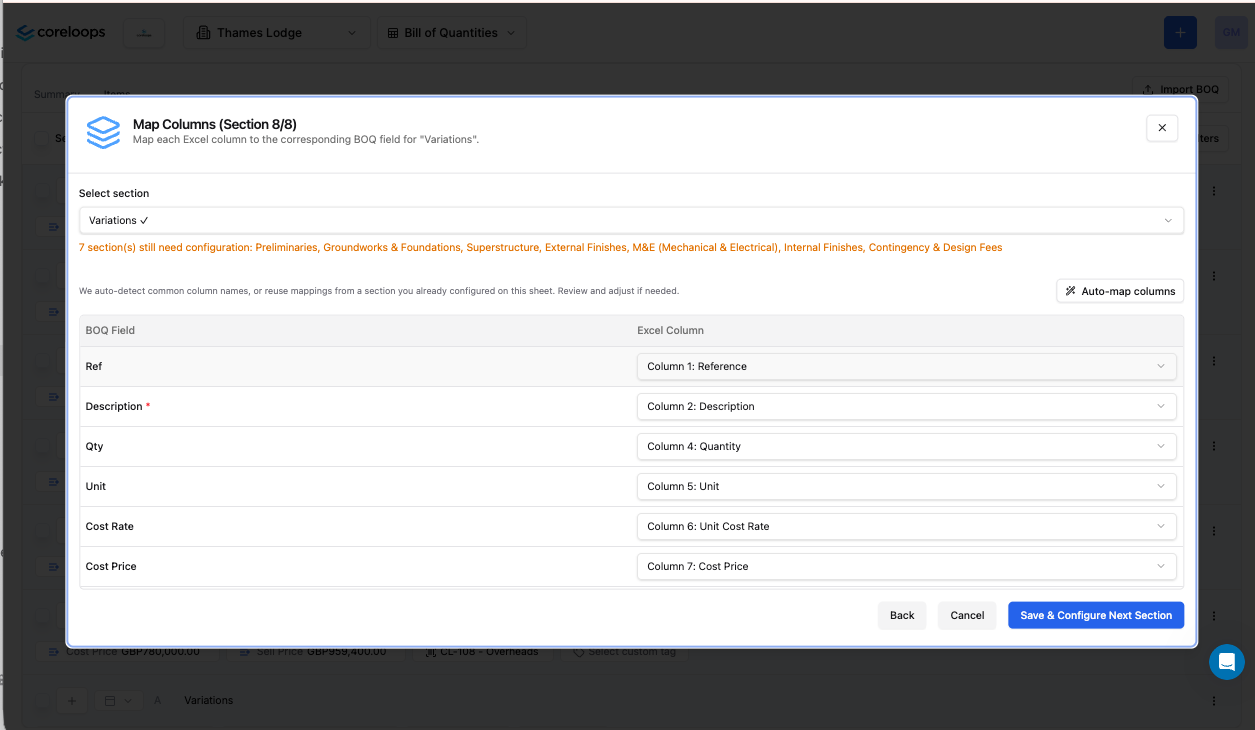
Step 9 — Preview and confirm
Check that sections and sub-sections are in the right order, line items sit under the right sub-section, and quantities and rates look right. If anything is wrong, fix the spreadsheet and upload it again. Otherwise, click Confirm.
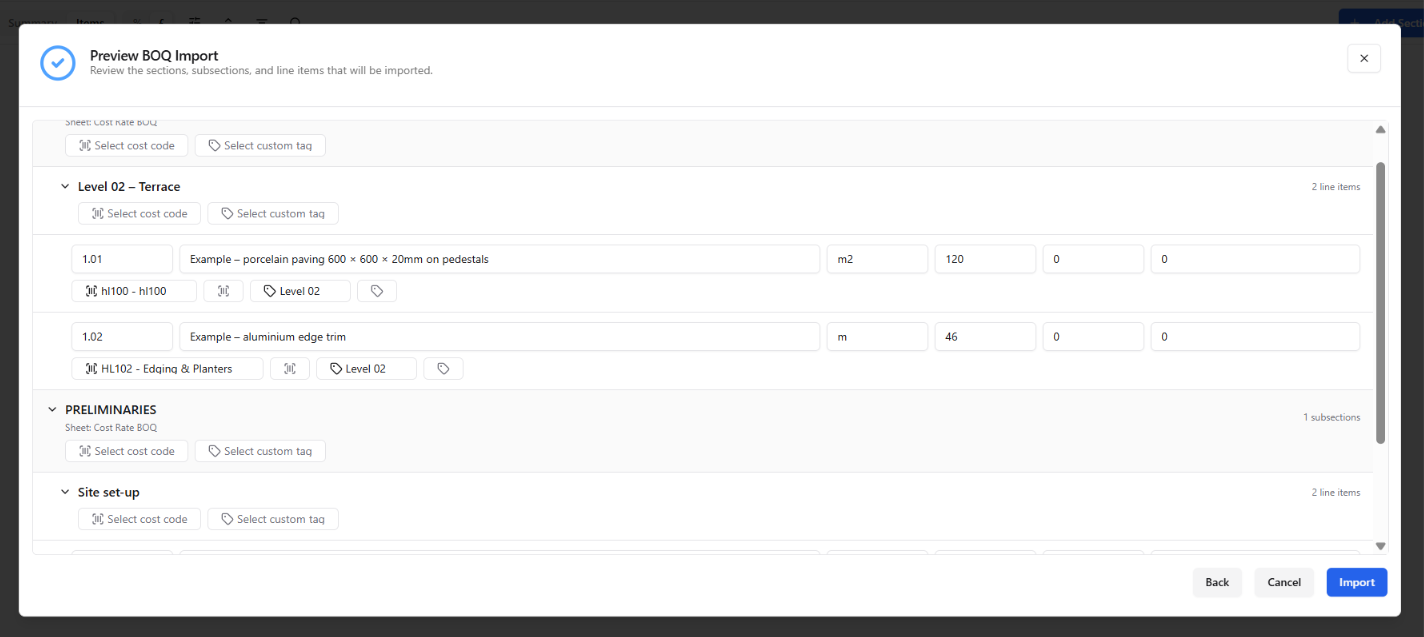
[Image: import preview – new screenshot]
Adding to a BOQ that already has sections
On a BOQ that already has sections, use Import BOQ from the Summary tab. Sections from the file are added after the existing ones.
When selecting a sheet, ensure the Has Sections column is checked.
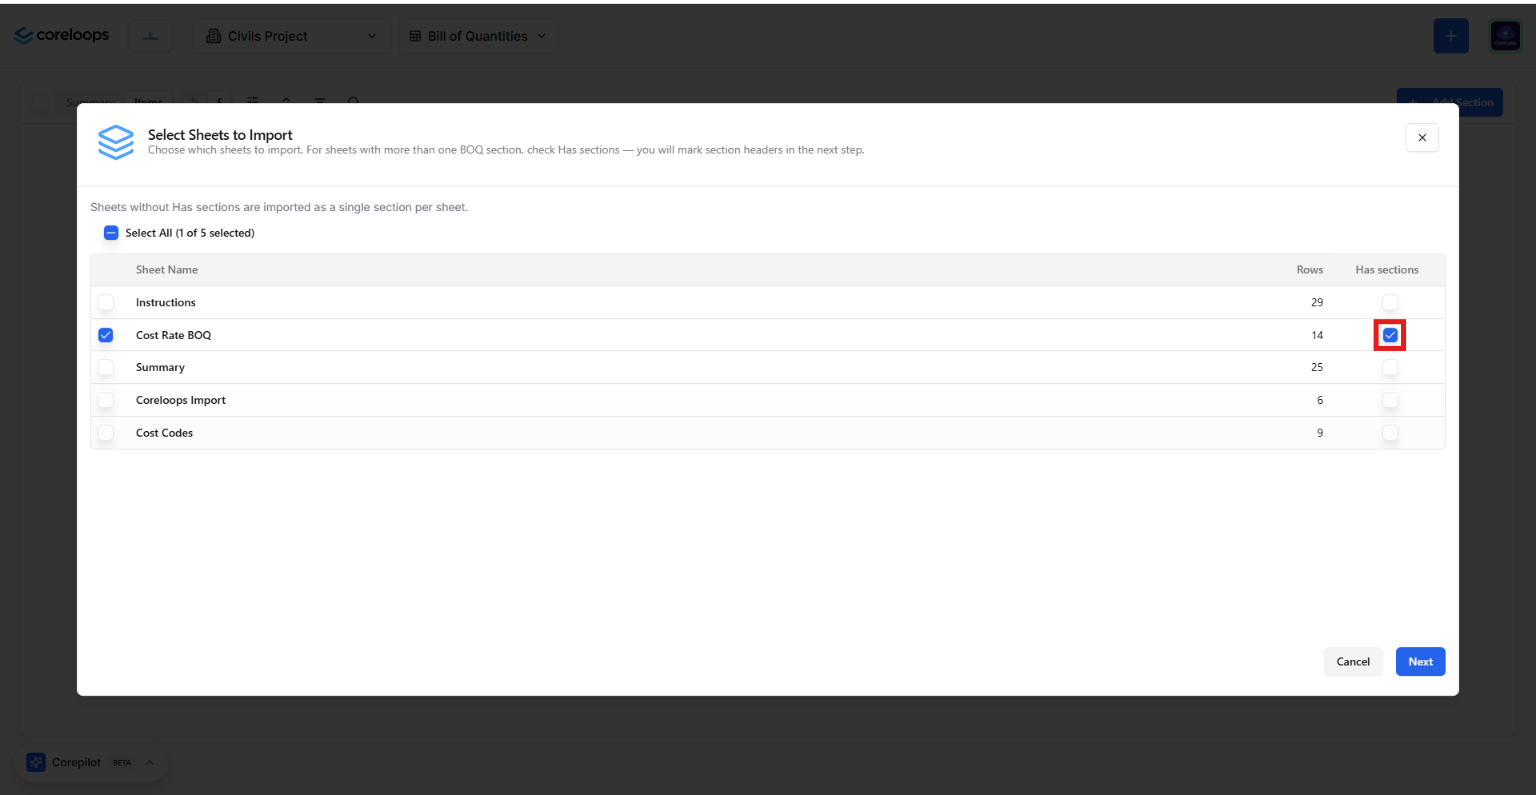
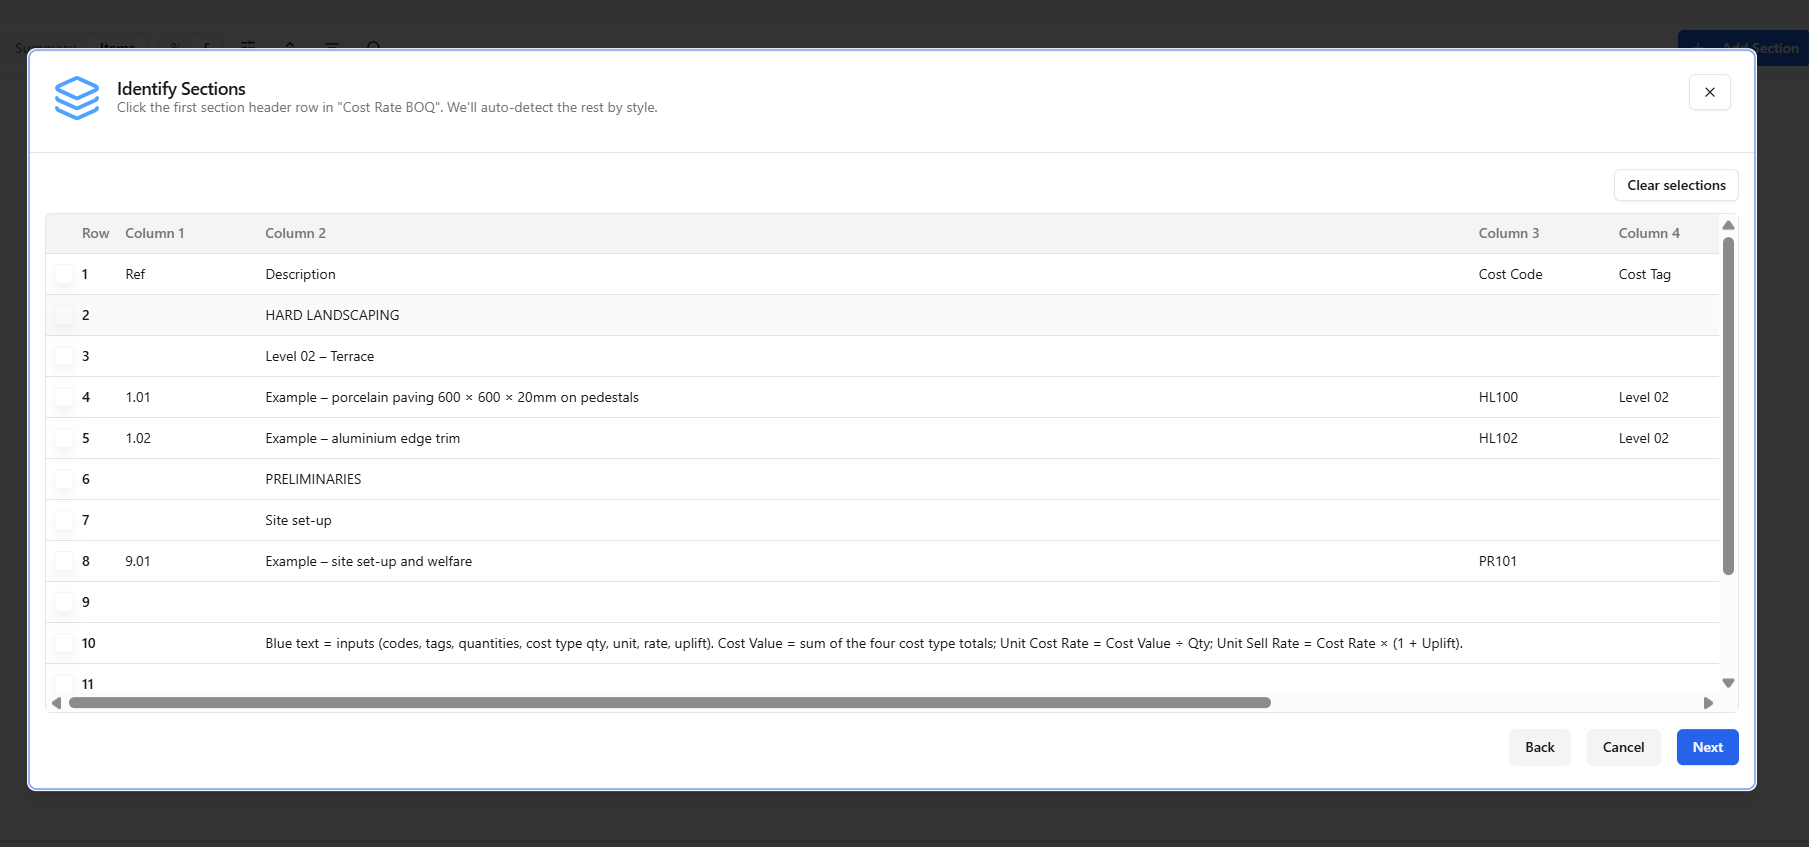
Select a row which contains a section header
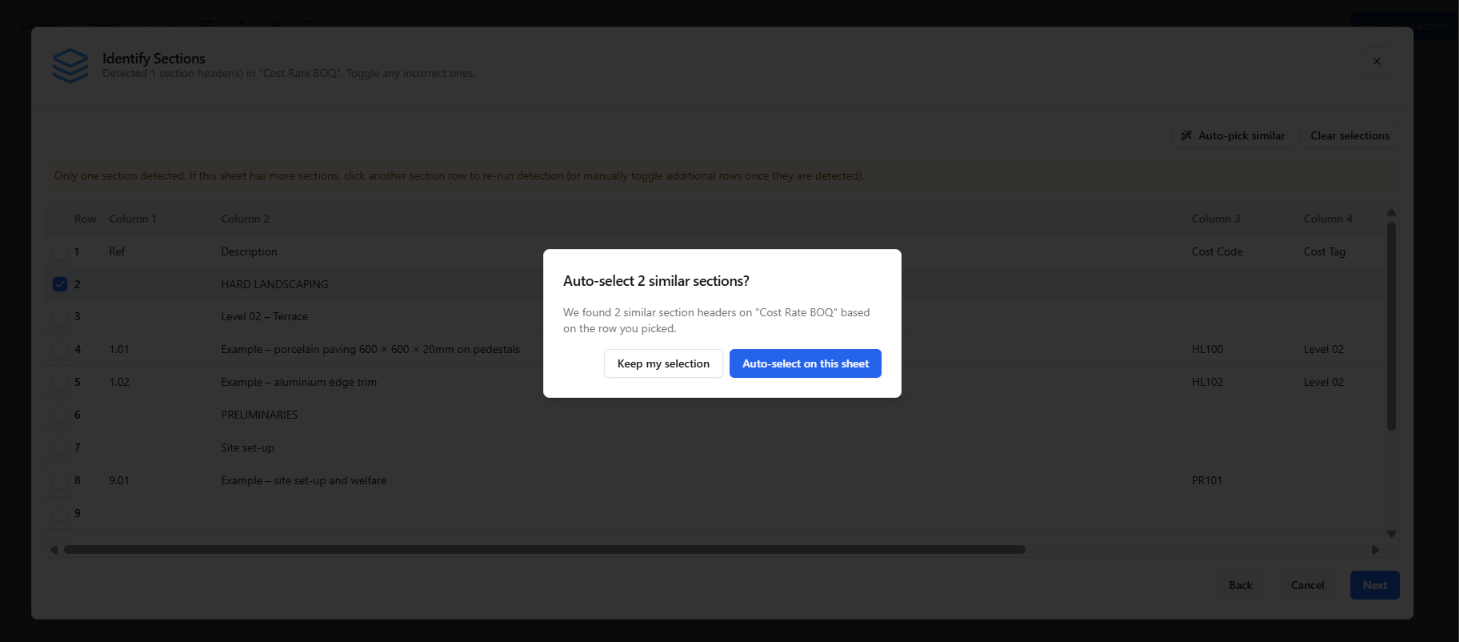
Coreloops will ask to auto-select sections in the sheet, where it will look to identify similar rows in the spreadsheet. Select Keep my selection if you have selected the only section in the import or if you want to do it manually
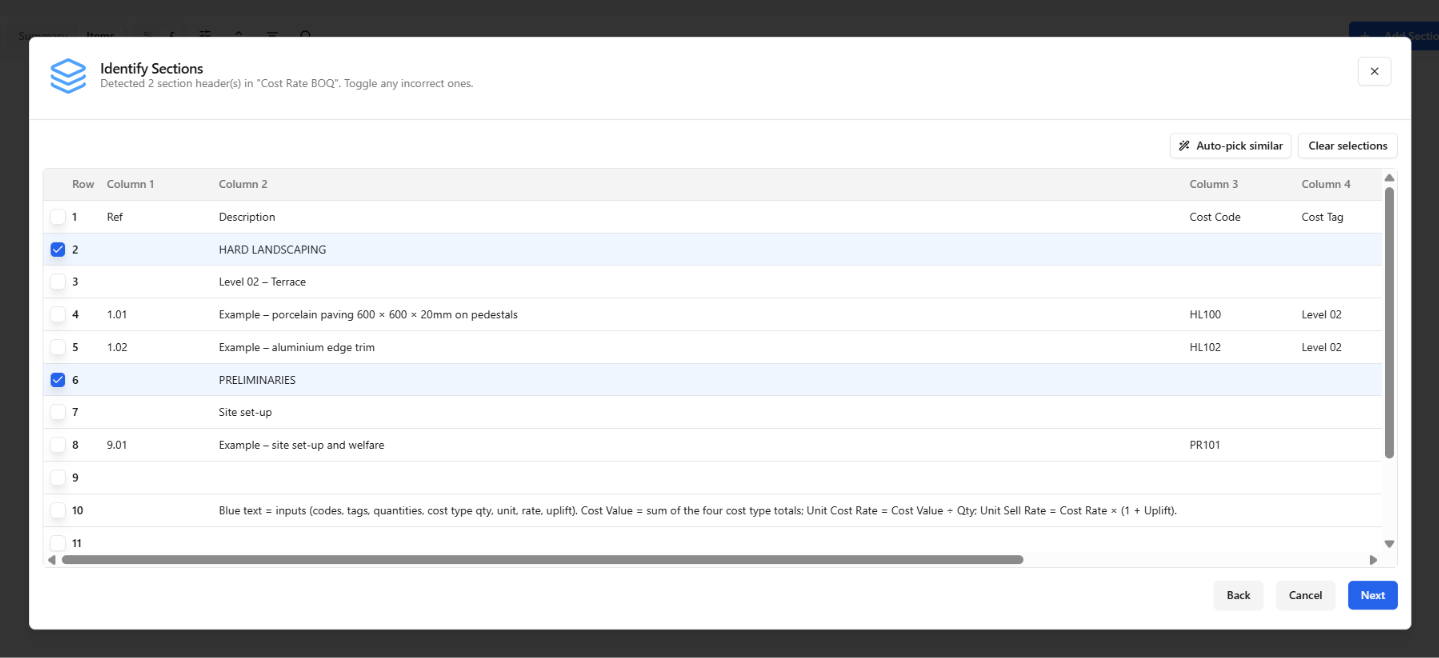
Preview the sections before selecting Next and carrying out the import as shown above
Level 2: Add cost codes and tags
Bring your lines in already coded, so the budget and actual cost report by cost code and tag from the first day.
Prepare your spreadsheet
Add a Cost Code column and/or a Tags column.
Use cost codes for the categories you reuse on every job (e.g. Paving & Surfacing). Use tags for groupings that only apply to this project, such as block, level or phase.
To give one line more than one cost code or tag, put them in the same cell separated by commas, e.g. Groundworks, Drainage. Spaces around the commas are ignored.

Map the columns (Step 8)
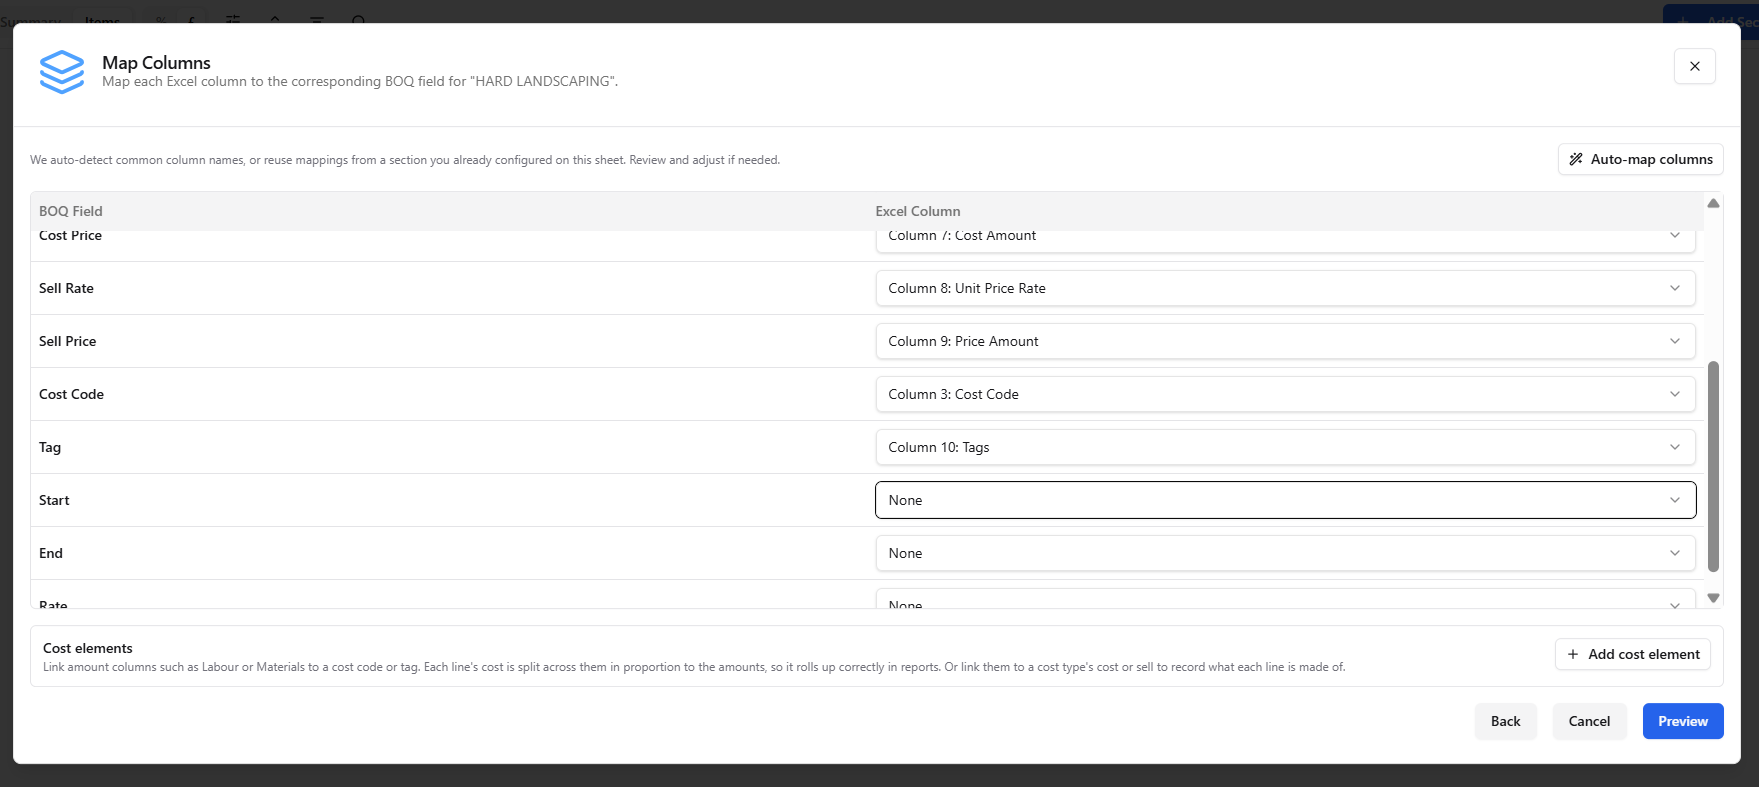
On the Map Columns screen, map your Cost Code column to Cost Code and your Tags column to Tags, alongside the Level 1 fields.
Values that match an existing cost code or tag are linked automatically.
Values that don't match can be created as new cost codes or tags during the import.
No cost codes in your spreadsheet?
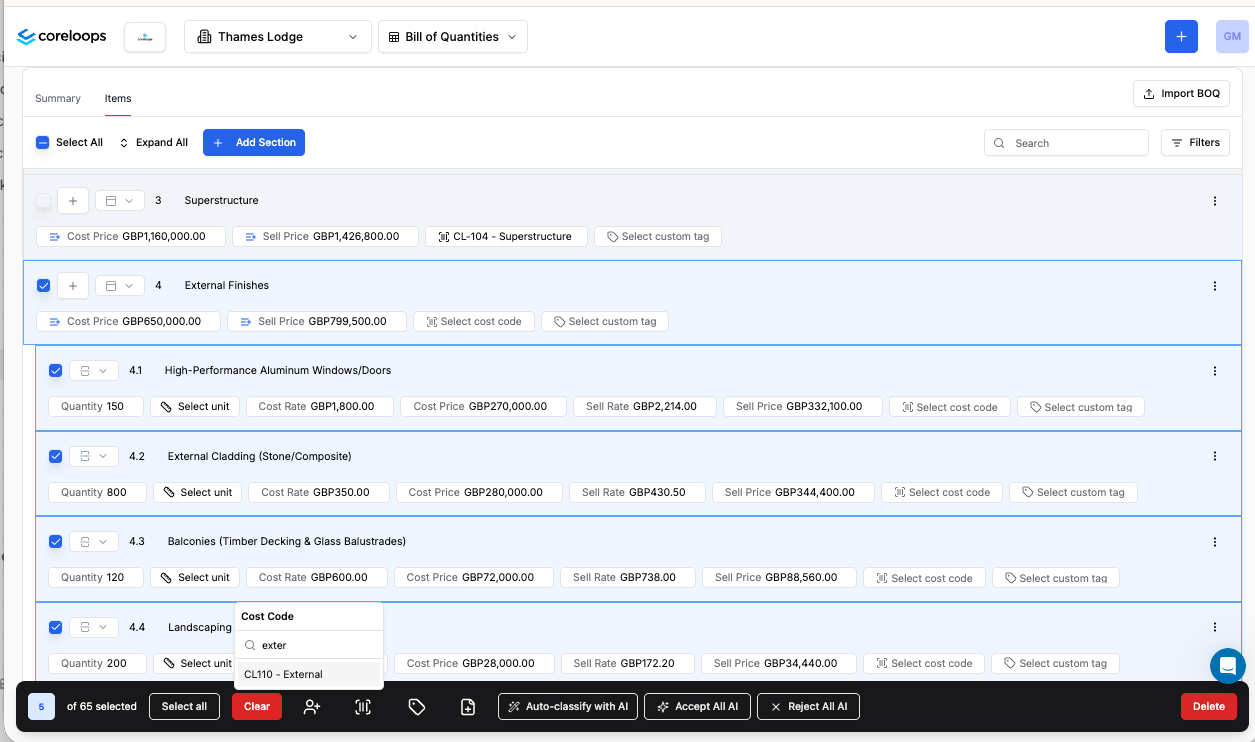
After the import, assign them in bulk:
Tick the line items, or click a sub-section to select everything in it.
Click Select cost code in the action bar.
Search for the code and select it.
Level 3: Add a cost type breakdown
If your estimate shows what each line is made of, bring that in too. Each line is then split into labour, subcontract, plant and materials, each with its own quantity, unit, rate and total, for cost and sell. Cost types need to be switched on for your company; contact us if you don't see them.
Prepare your spreadsheet
For each cost type, add the columns you have:
A cost type's quantity and unit can differ from the line's. A paving line in m² can carry labour in days and materials in m².
Leave a cost type's quantity and unit out and it takes the line's.
You can bring in cost, sell, or both. Put the cost type name in each header (e.g. Plant Rate (£)) to make mapping quicker.

Map the cost types (Step 8)
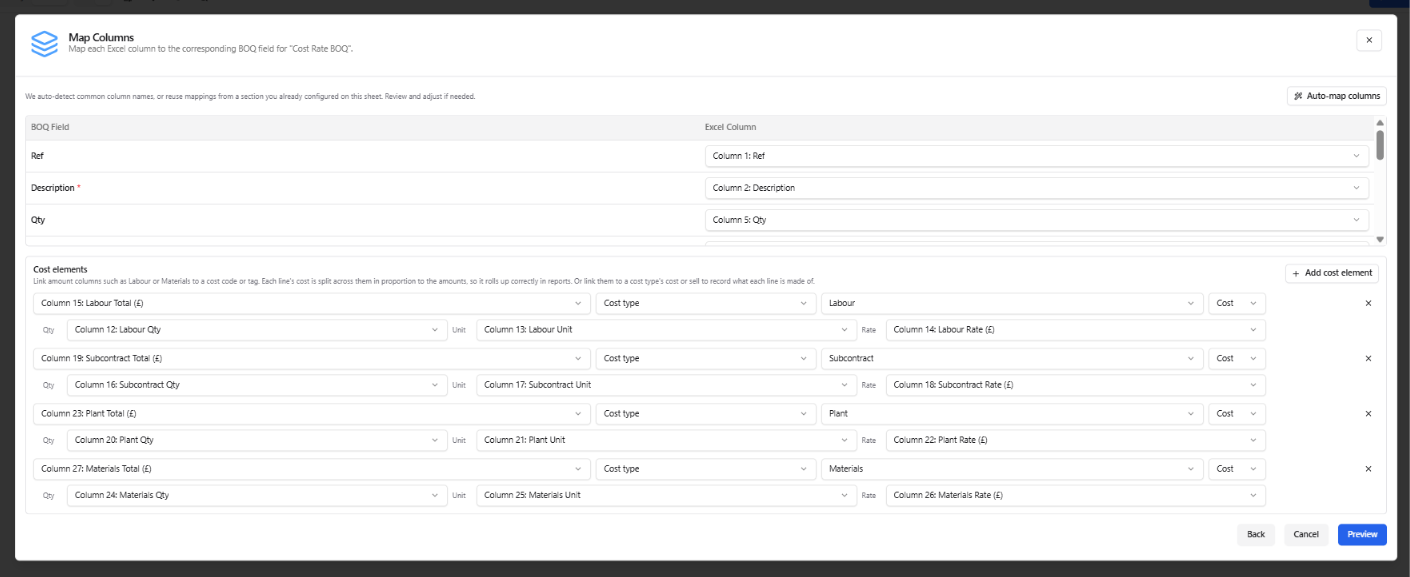
In the Cost elements section of the Map Columns screen:
Click + Add cost element.
Pick the column holding the cost type's total (e.g. Labour Total (£)).
Choose Cost type, then the cost type it belongs to (e.g. Labour).
Choose Cost or Sell.
In the row below, pick that cost type's Qty, Unit and Rate columns, if you have them.
Repeat for each cost type, and for cost and sell separately. Most sheets need four to eight rows.
Any cost type you don't map isn't imported.
Check the breakdown after the import
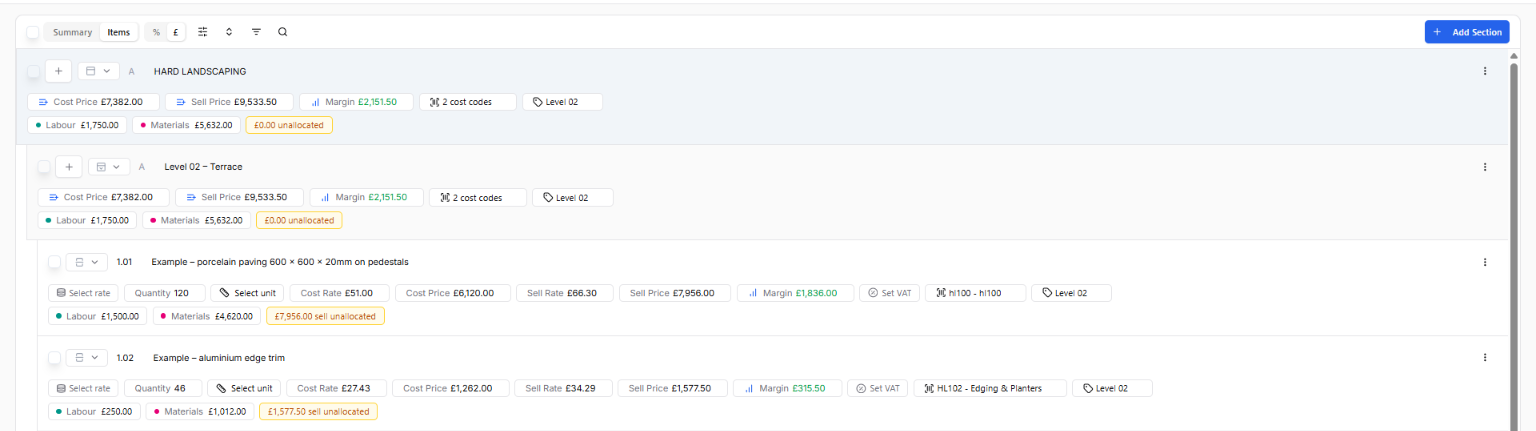
Labels under each row show its cost types. Amber means part of the line isn't allocated to a cost type; red means more is allocated than the line's total. Section rows show the totals beneath them.
Cost type checks on the Items tab lists lines that don't add up and priced lines with no cost types.
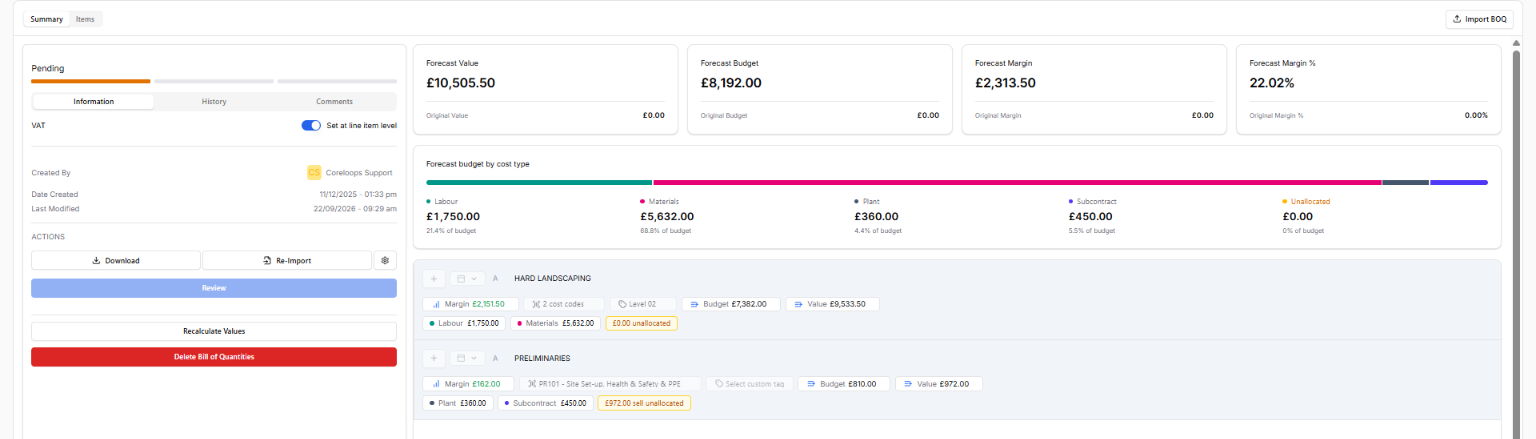
Forecast budget by cost type on the Summary tab shows how the budget splits by type, plus anything unallocated.
Fix or add cost types after the import
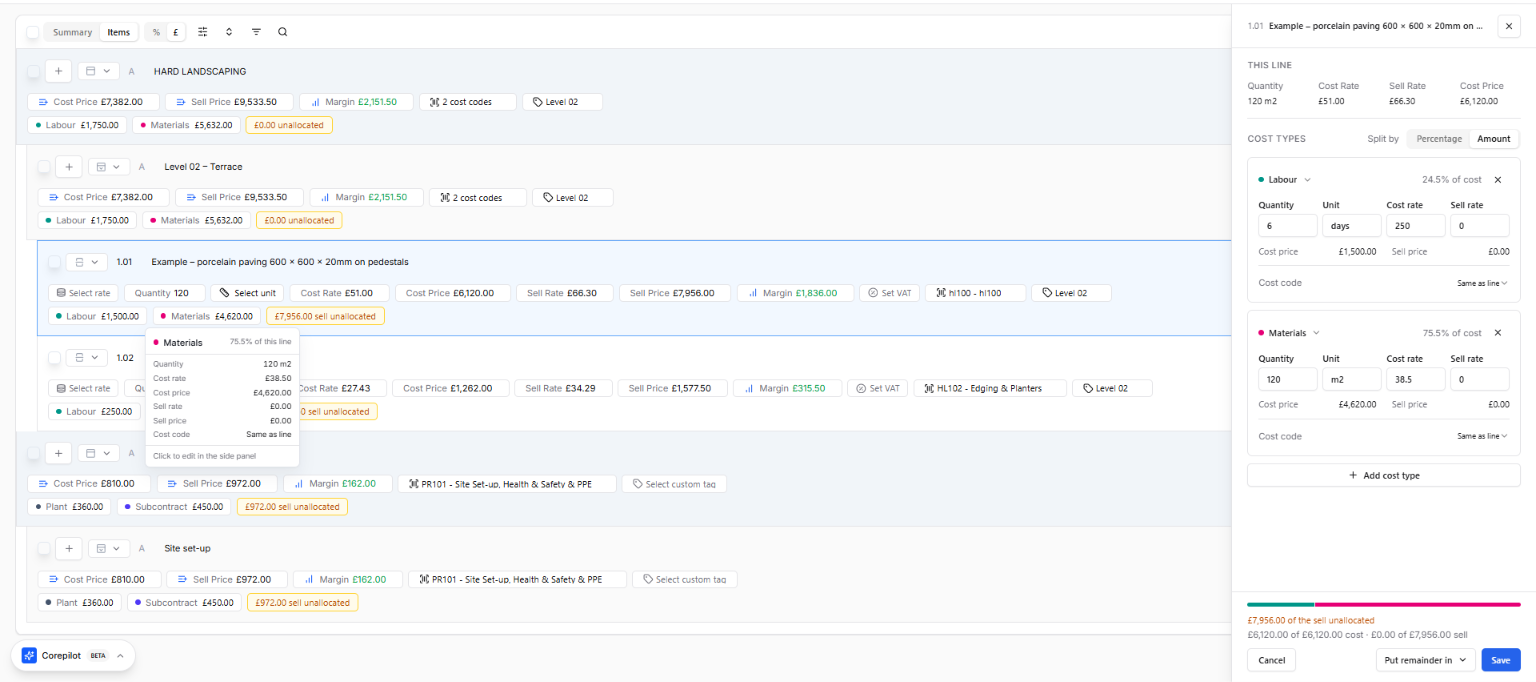
One line: open it in the side panel and split it by percentage or by amount. Each cost type uses the line's cost code unless you give it its own.
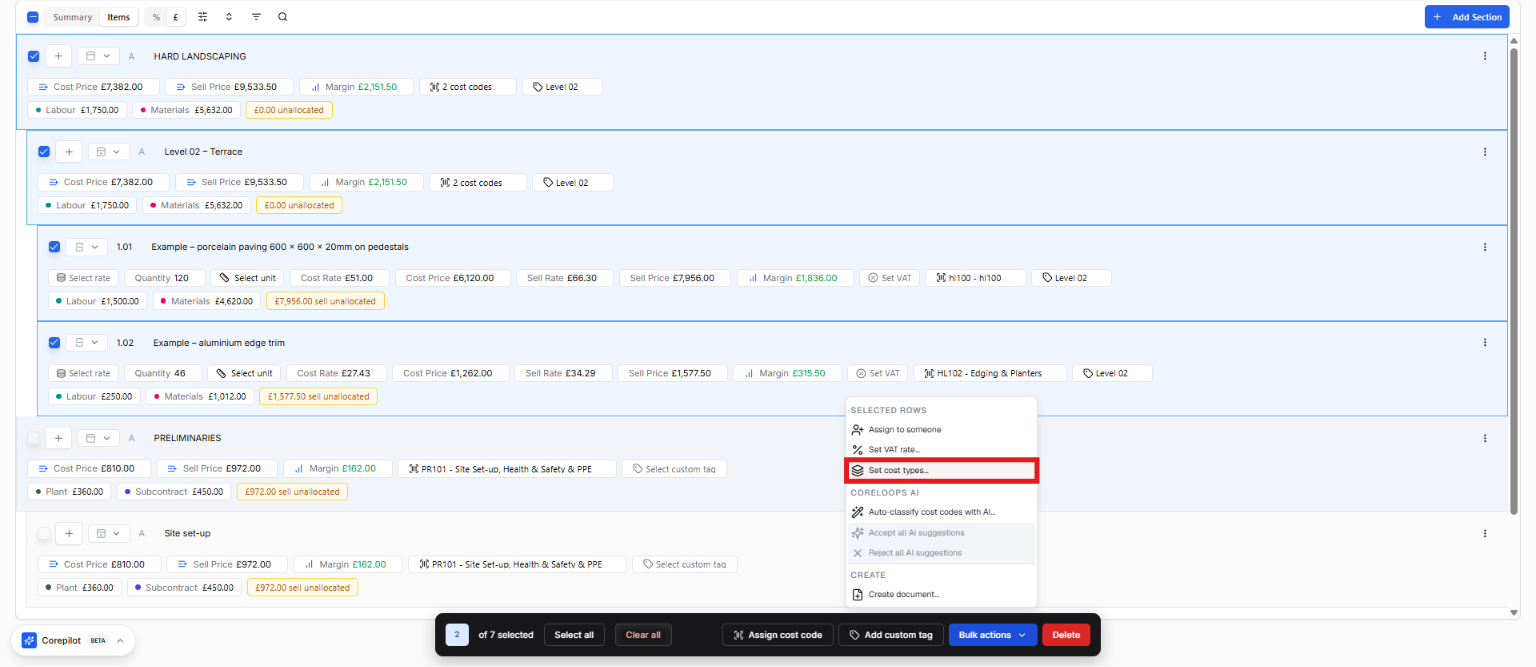
Many lines: select them (or a section) and use Bulk actions → Set cost types to split them by percentage. Existing cost types on those lines are replaced, and you're told how many first.
Tips and troubleshooting
Line items appear blank: check every row has a description.
Sections not detected: if colour coding didn't work, click each section header row yourself in Step 5.
Cost type amounts look wrong: check Cost or Sell is set correctly for each cost element, and that its Qty and Rate columns belong to the same cost type as its total.
A cost type is missing: cost types you don't map aren't imported. Go back to Map Columns and add a cost element for it.
Amber labels after import: the cost types don't add up to the line's total. Fix them in the side panel, or check the spreadsheet's totals.
Something imported incorrectly: delete the BOQ and import it again from a corrected spreadsheet. The import doesn't update lines already in the BOQ.
File too large: keep your file under 10 MB.
Was this helpful?
Still need help? Ask the team